
Summary
Connects Claude to MetricUI's React dashboard component library. Exposes API lookups for KPI cards, charts, tables, and layout components, generates ready-to-use code snippets with proper props, and validates component configurations. Useful when building analytics dashboards or data visualization UIs with AI assistance. Claude can look up which props AreaChart accepts, scaffold a complete dashboard with comparison data and reference lines, or validate that your KpiCard configuration matches the actual API. Works over stdio. The source library includes 20+ chart types, built-in theming, and handles formatting, loading states, and responsive layouts out of the box.


Keeps your Mac awake while Claude Code, Codex or Cursor works. Lets it sleep when they are done.
Try free for 7 days →

Block distracting apps from your iPhone permanently without a 3rd party app. Free and open source.
Block now (100% free) →
Notes, actions and memory. Without a meeting bot. First month 100% off.
Download for free →
belt cli automatically finds the best tools and skills for your agent. image, video, music, tts...
one prompt install →
Free an open-source skills that make AI coding agents easier to understand, verify, and control.
Download for free →

Connect your Claude agent to live crypto prices and trading routes via 1inch
Get the MCP →

MetricUI
The missing UI layer for React dashboards.
KPI cards, charts, tables, and layout — with built-in formatting, theming, data states, and zero config.
Homepage · Docs · Analytics Demo · SaaS Demo · GitHub Demo · Wikipedia Live · MCP Server · Roadmap
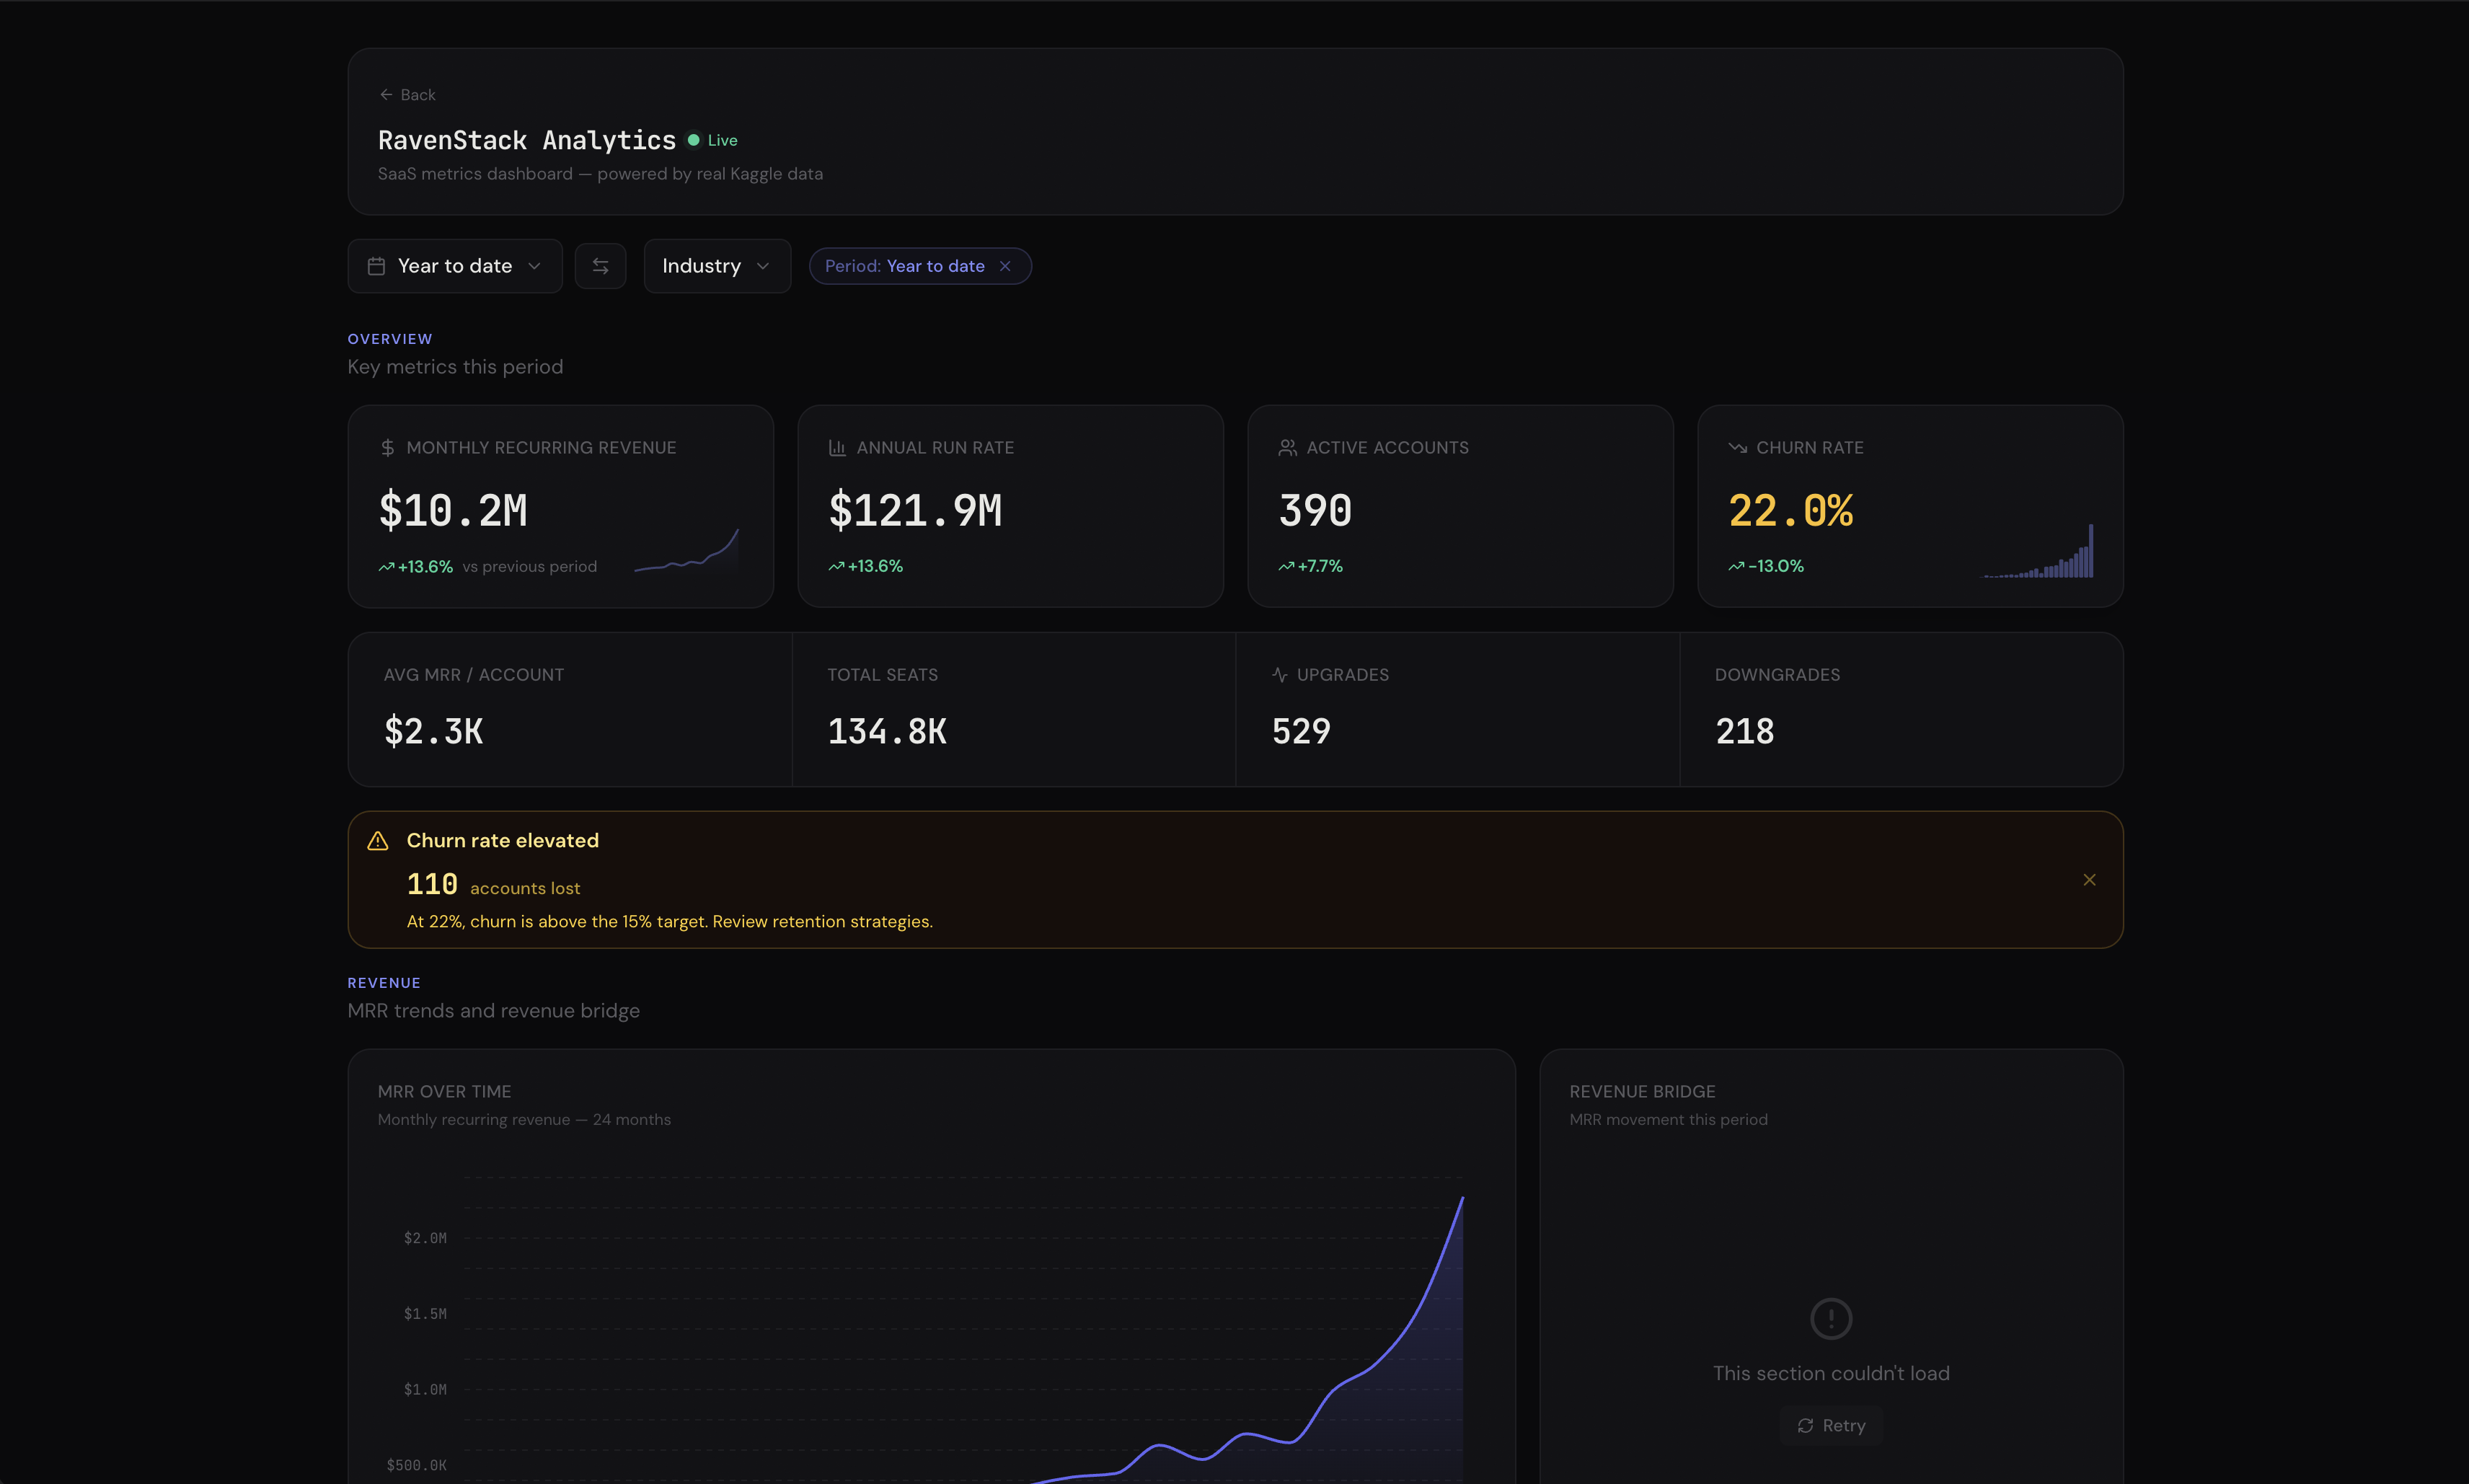
Web Analytics · SaaS Metrics · GitHub Analytics · Wikipedia Live · World Explorer — all with AI Insights, cross-filtering, drill-downs, and export.
Install
npm install metricui
That's it. All chart dependencies are included.
CDN (no bundler needed)
For browser sandboxes, Claude artifacts, v0, Bolt, or anywhere without npm:
import { KpiCard, AreaChart, MetricProvider } from "https://cdn.jsdelivr.net/npm/metricui@latest/dist/metricui.browser.mjs";
<link rel="stylesheet" href="https://cdn.jsdelivr.net/npm/metricui@latest/dist/styles.css" />
Why MetricUI?
You're building a dashboard. You need KPI cards, charts, tables. You reach for Recharts + shadcn + custom CSS and spend days wiring up formatting, dark mode, loading states, and responsive layouts.
Stop assembling dashboards from parts.
import {
  Dashboard, DashboardHeader, PeriodSelector,
  MetricGrid, KpiCard, AreaChart, DonutChart, DataTable, Callout,
} from "metricui";
import "metricui/styles.css";

export default function App() {
  return (
    <Dashboard theme="emerald" filters={{ defaultPreset: "30d" }}>
      <DashboardHeader title="Revenue" lastUpdated={new Date()} actions={<PeriodSelector comparison />} />

        <MetricGrid>
          <MetricGrid.Section title="Key Metrics" />
          <KpiCard title="Revenue" value={127450} format="currency"
            comparison={{ value: 113500 }} comparisonLabel="vs last month"
            sparkline={{ data: [89, 94, 99, 103, 109, 114, 127], previousPeriod: [78, 82, 85, 88, 91, 95, 98] }}
            conditions={[
              { when: "above", value: 120000, color: "emerald" },
              { when: "below", value: 90000, color: "red" },
            ]}
          />
          <KpiCard title="Users" value={8420} format="compact"
            comparison={[{ value: 7680, label: "vs last month" }, { value: 6200, label: "vs last year" }]}
            highlight
          />
          <KpiCard title="Churn" value={3.2} format="percent"
            comparison={{ value: 3.7, invertTrend: true }}
            goal={{ value: 2.5, showTarget: true, showRemaining: true }}
          />

          <Callout value={12.3} rules={[
            { min: 10, variant: "success", title: "Strong Growth", message: "Revenue grew {value}% this month." },
            { max: 0, variant: "error", title: "Revenue Declined", message: "Revenue dropped {value}%." },
          ]} />

          <MetricGrid.Section title="Trends" border />
          <AreaChart data={revenueData} comparisonData={prevPeriod} format="currency" title="Revenue Trend"
            referenceLines={[{ axis: "y", value: 50000, label: "Target", style: "dashed" }]}
            thresholds={[{ from: 0, to: 30000, color: "#EF4444", opacity: 0.05 }]}
          />
          <DonutChart data={planBreakdown} format="currency" title="By Plan" centerValue="$127K" centerLabel="Total" />

          <MetricGrid.Section title="Details" border />
          <DataTable data={customers} title="Top Customers" columns={columns} searchable pageSize={10} />
        </MetricGrid>
    </Dashboard>
  );
}
Zero layout code. <Dashboard> wraps all providers (theme, filters, cross-filter, drill-down, linked hover) in one component. MetricGrid auto-detects component types — KPIs row up, charts pair, tables go full width. DashboardHeader shows live status with auto-ticking "Updated Xm ago". Responsive out of the box.
Features
AI Insights — Bring Your Own LLM
Drop <DashboardInsight /> into any dashboard. A floating chat button appears — click it, ask questions about your data. The AI auto-collects live data from every component, builds context-rich prompts, and streams analysis. Use @ to reference specific charts. Works with any LLM (OpenAI, Anthropic, local models). Docs →
<Dashboard ai={{ analyze: myLLM, company: "Acme Corp — B2B SaaS", context: "Q4 target: $500K" }}>
  <KpiCard title="Revenue" value={142800} aiContext="Primary metric. Enterprise drives 52%." />
  <DashboardInsight />
</Dashboard>
KPI Cards — Not Just Numbers
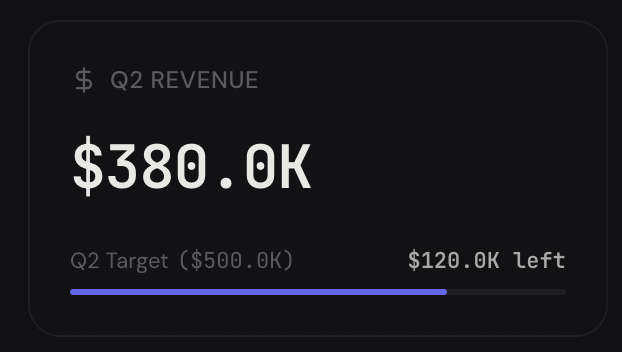
Sparkline with previous-period overlay. Goal progress bars. Conditional red/amber/green coloring. Multiple comparison badges. Copyable values. Drill-down links. Docs →
Headline Numbers on Any Chart
Every chart and table accepts a headline prop — a summary number in the card header that gives you the punchline at a glance.
<BarChart headline={{ value: 1200000, format: "currency", label: "Total" }} />
<BarChart headline="$1.2M total" />  // string shorthand
Supports formatting, comparison badges with trend arrows, and conditional coloring — same features as KpiCard, right in the chart header.
Charts with Reference Lines & Threshold Bands
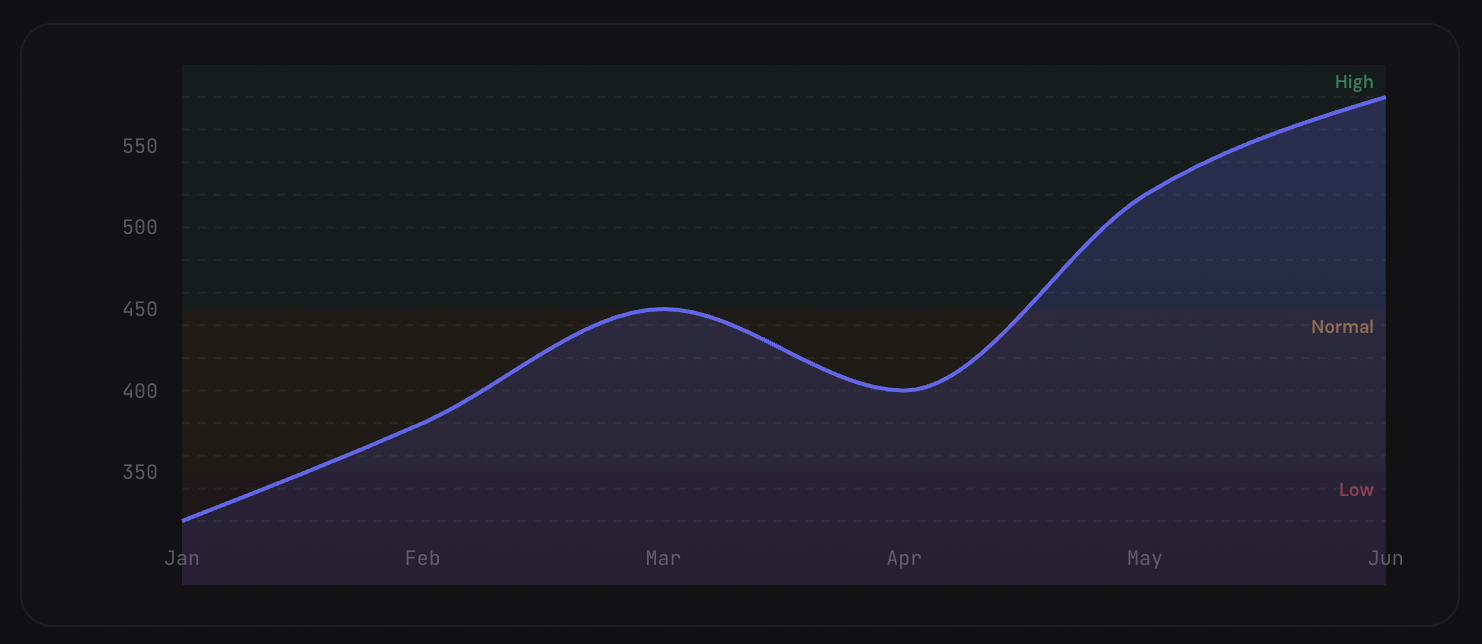
Mark targets, benchmarks, and danger zones directly on charts. Comparison overlays show period-over-period trends as dashed lines. Works on AreaChart, LineChart, and BarChart.
<AreaChart
  data={revenueData}
  comparisonData={previousPeriod}
  referenceLines={[{ axis: "y", value: 50000, label: "Target", style: "dashed" }]}
  thresholds={[{ from: 0, to: 30000, color: "#EF4444", opacity: 0.05 }]}
  format="currency"
/>
Data-Driven Alerts
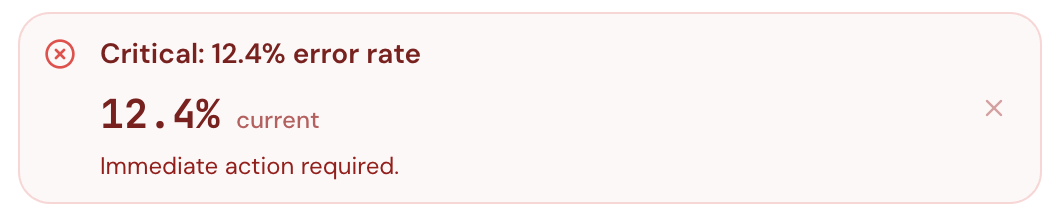
Pass a value and rules — Callout auto-selects the right variant, title, and message. Supports embedded formatted metrics, action buttons, collapsible detail, and auto-dismiss.
Expandable Data Tables
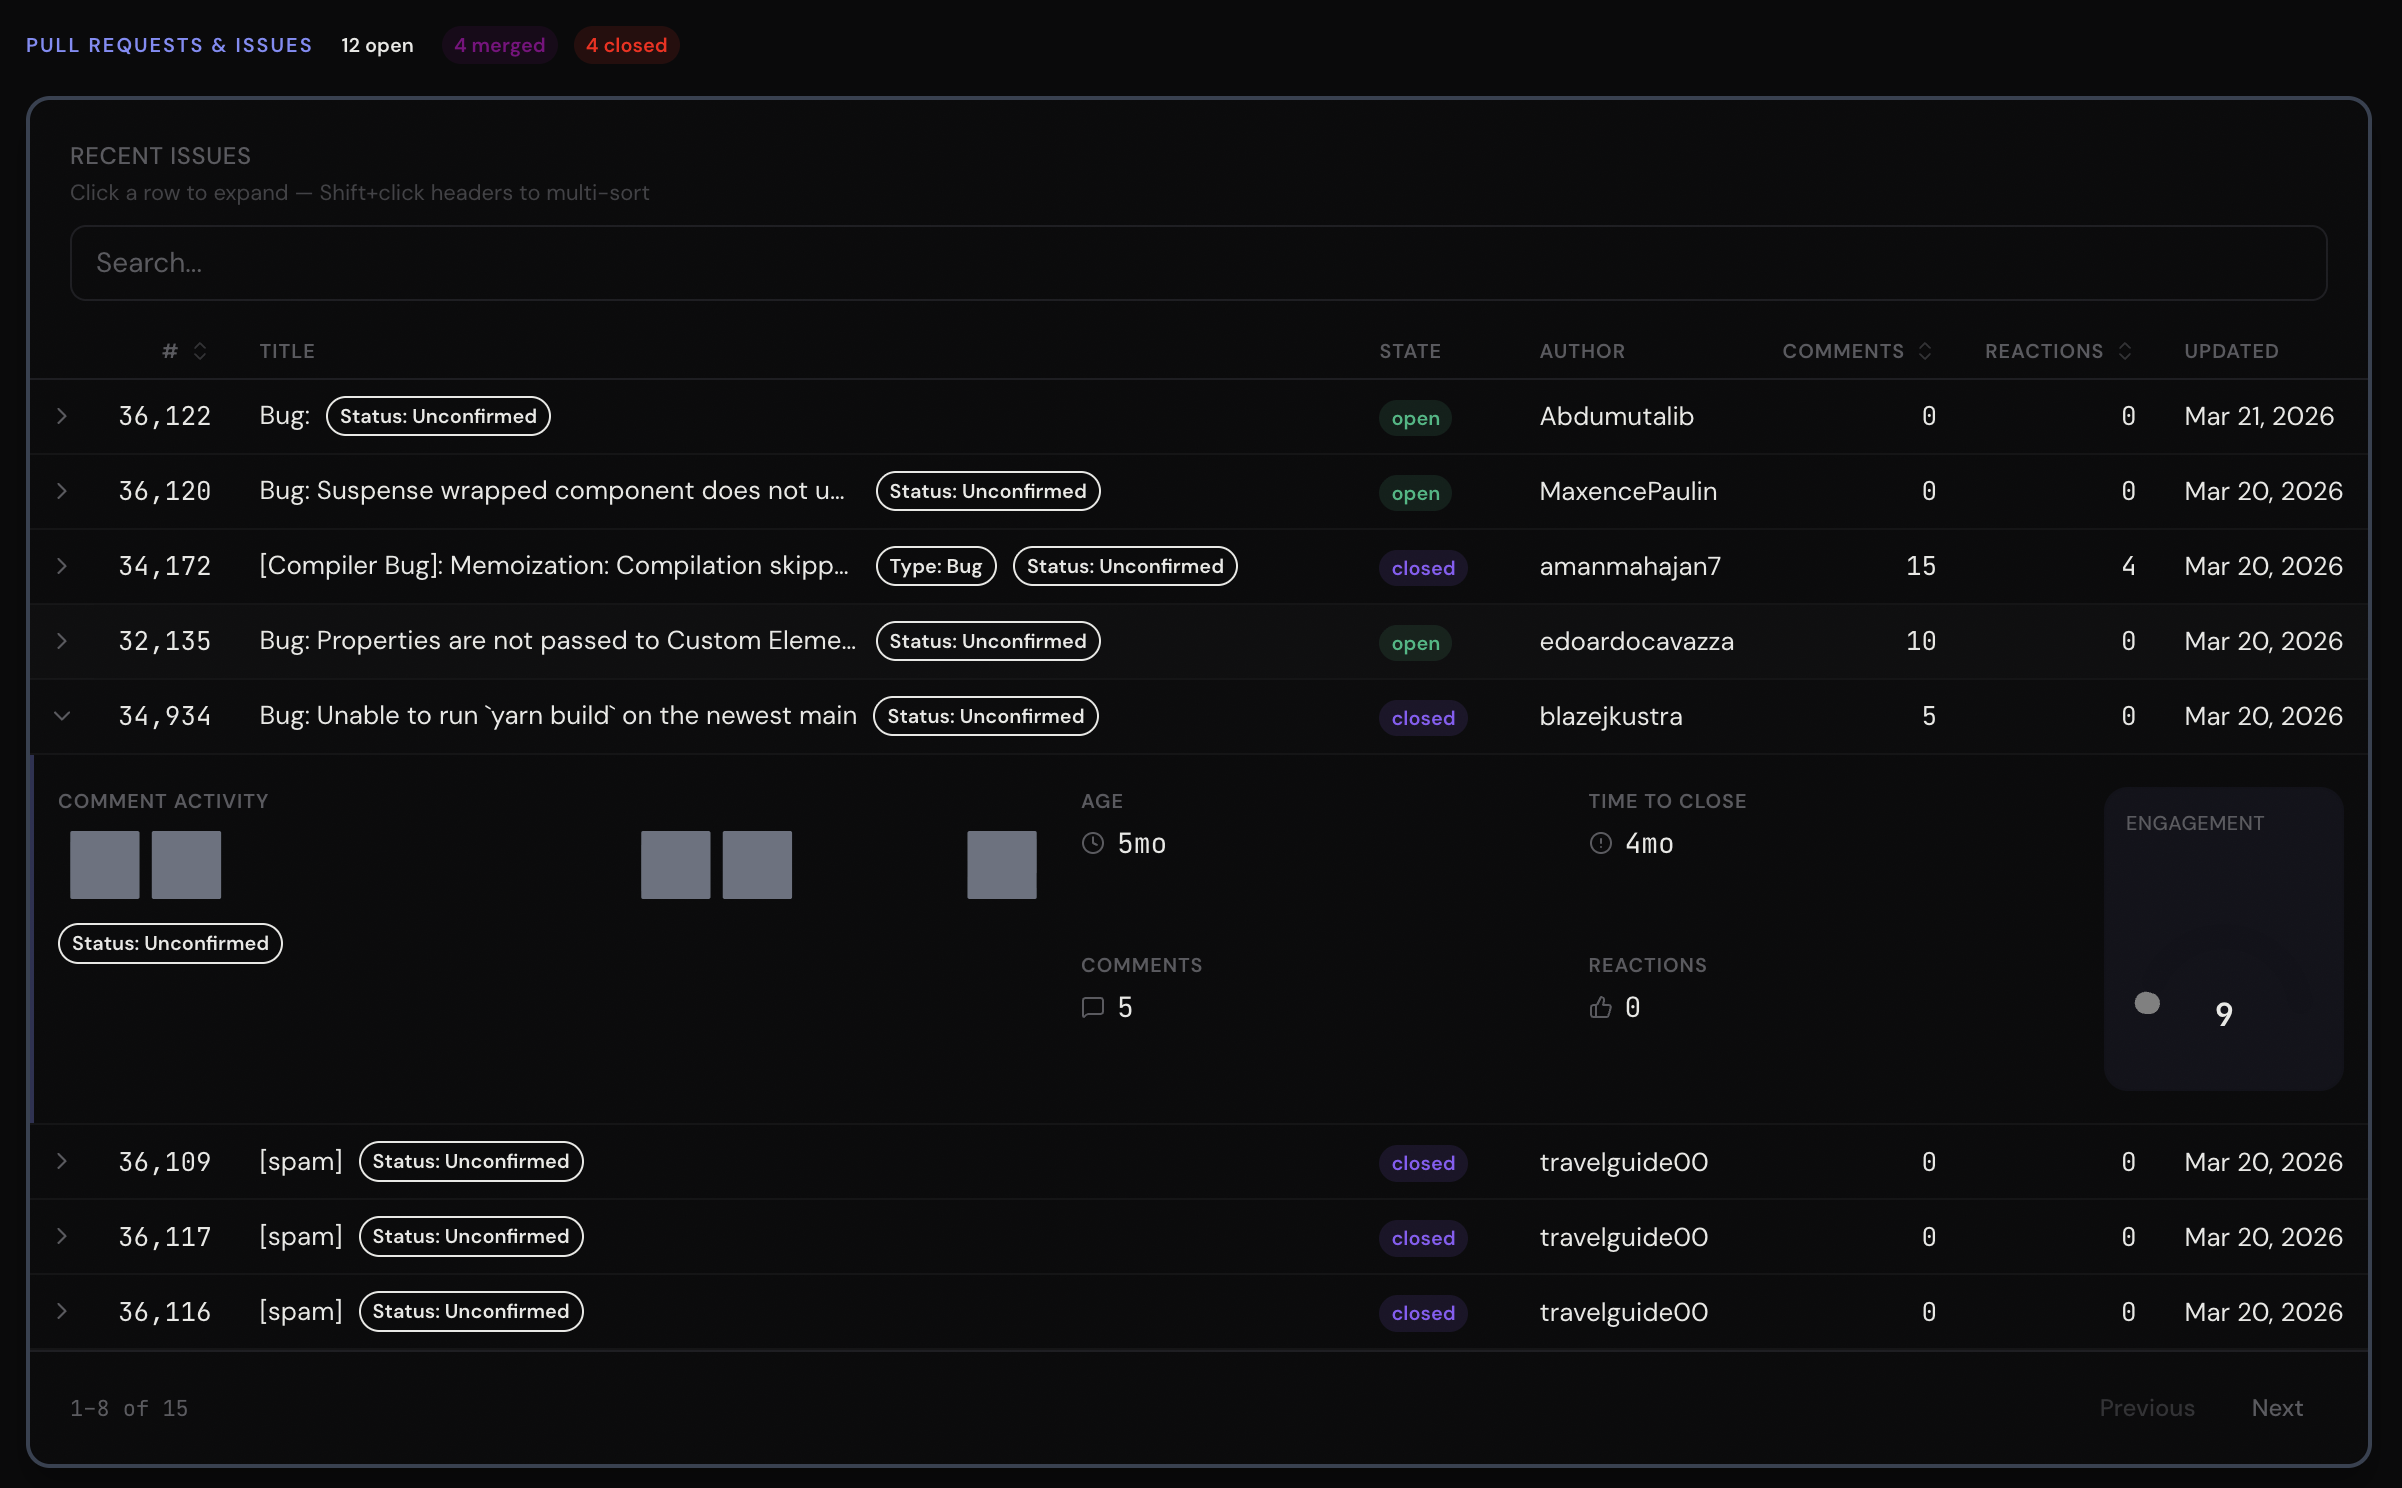
Click a row and a mini-dashboard slides open — sparklines, gauges, status indicators, badges. Plus search, multi-sort, pagination, pinned columns, 12 column types, and row conditions. Docs →
Conversion Funnels
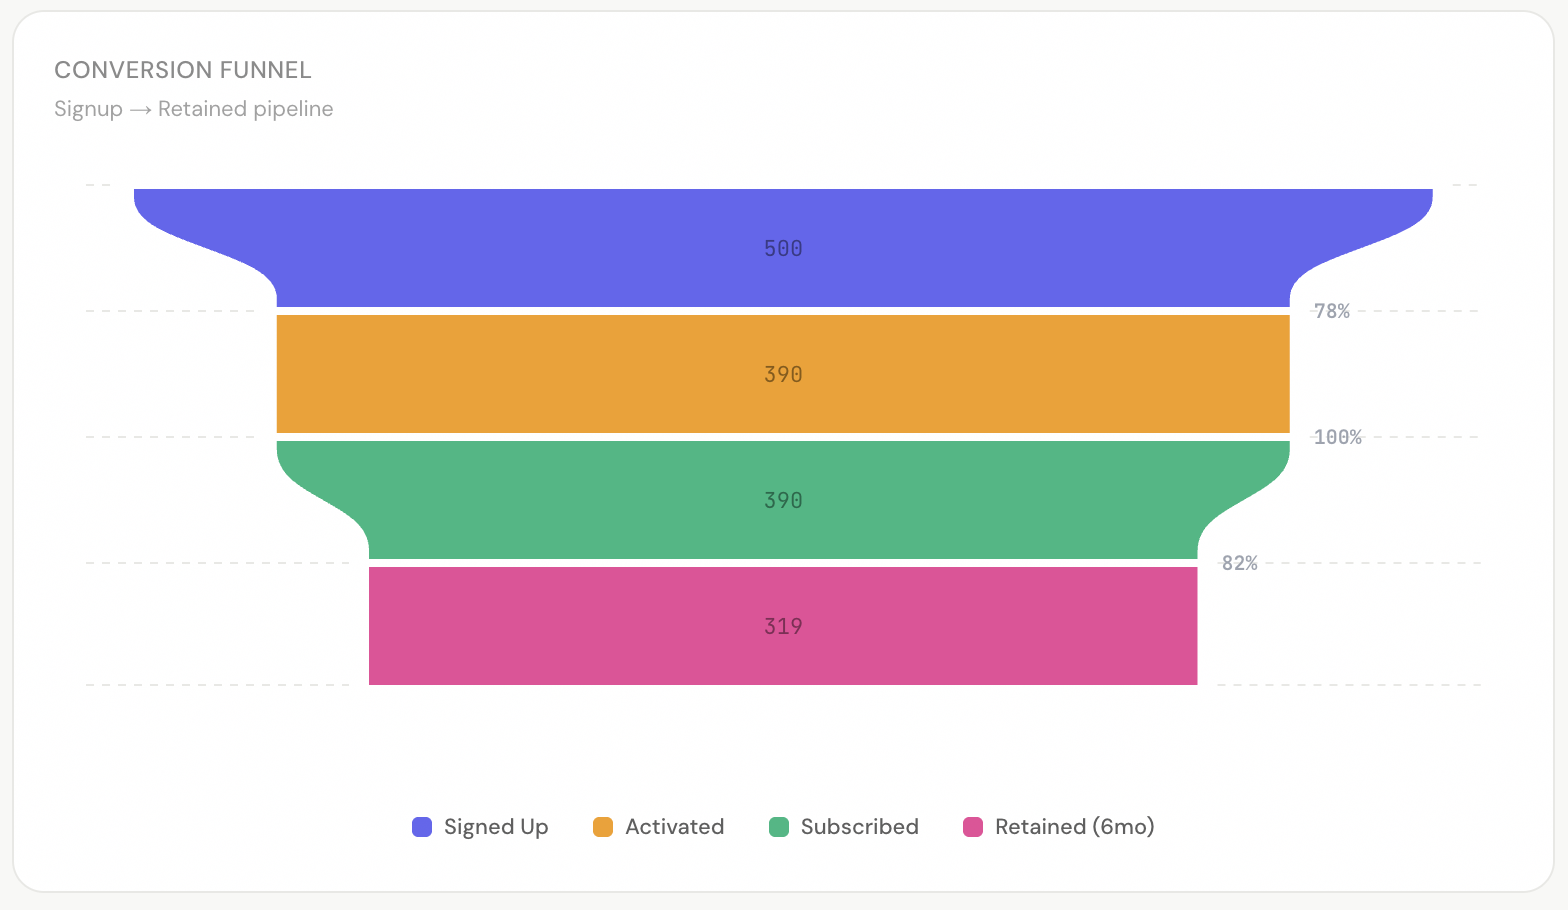
Auto-computed stage-to-stage conversion rates. Vertical or horizontal. Smooth or linear interpolation. Docs →
Light & Dark Mode
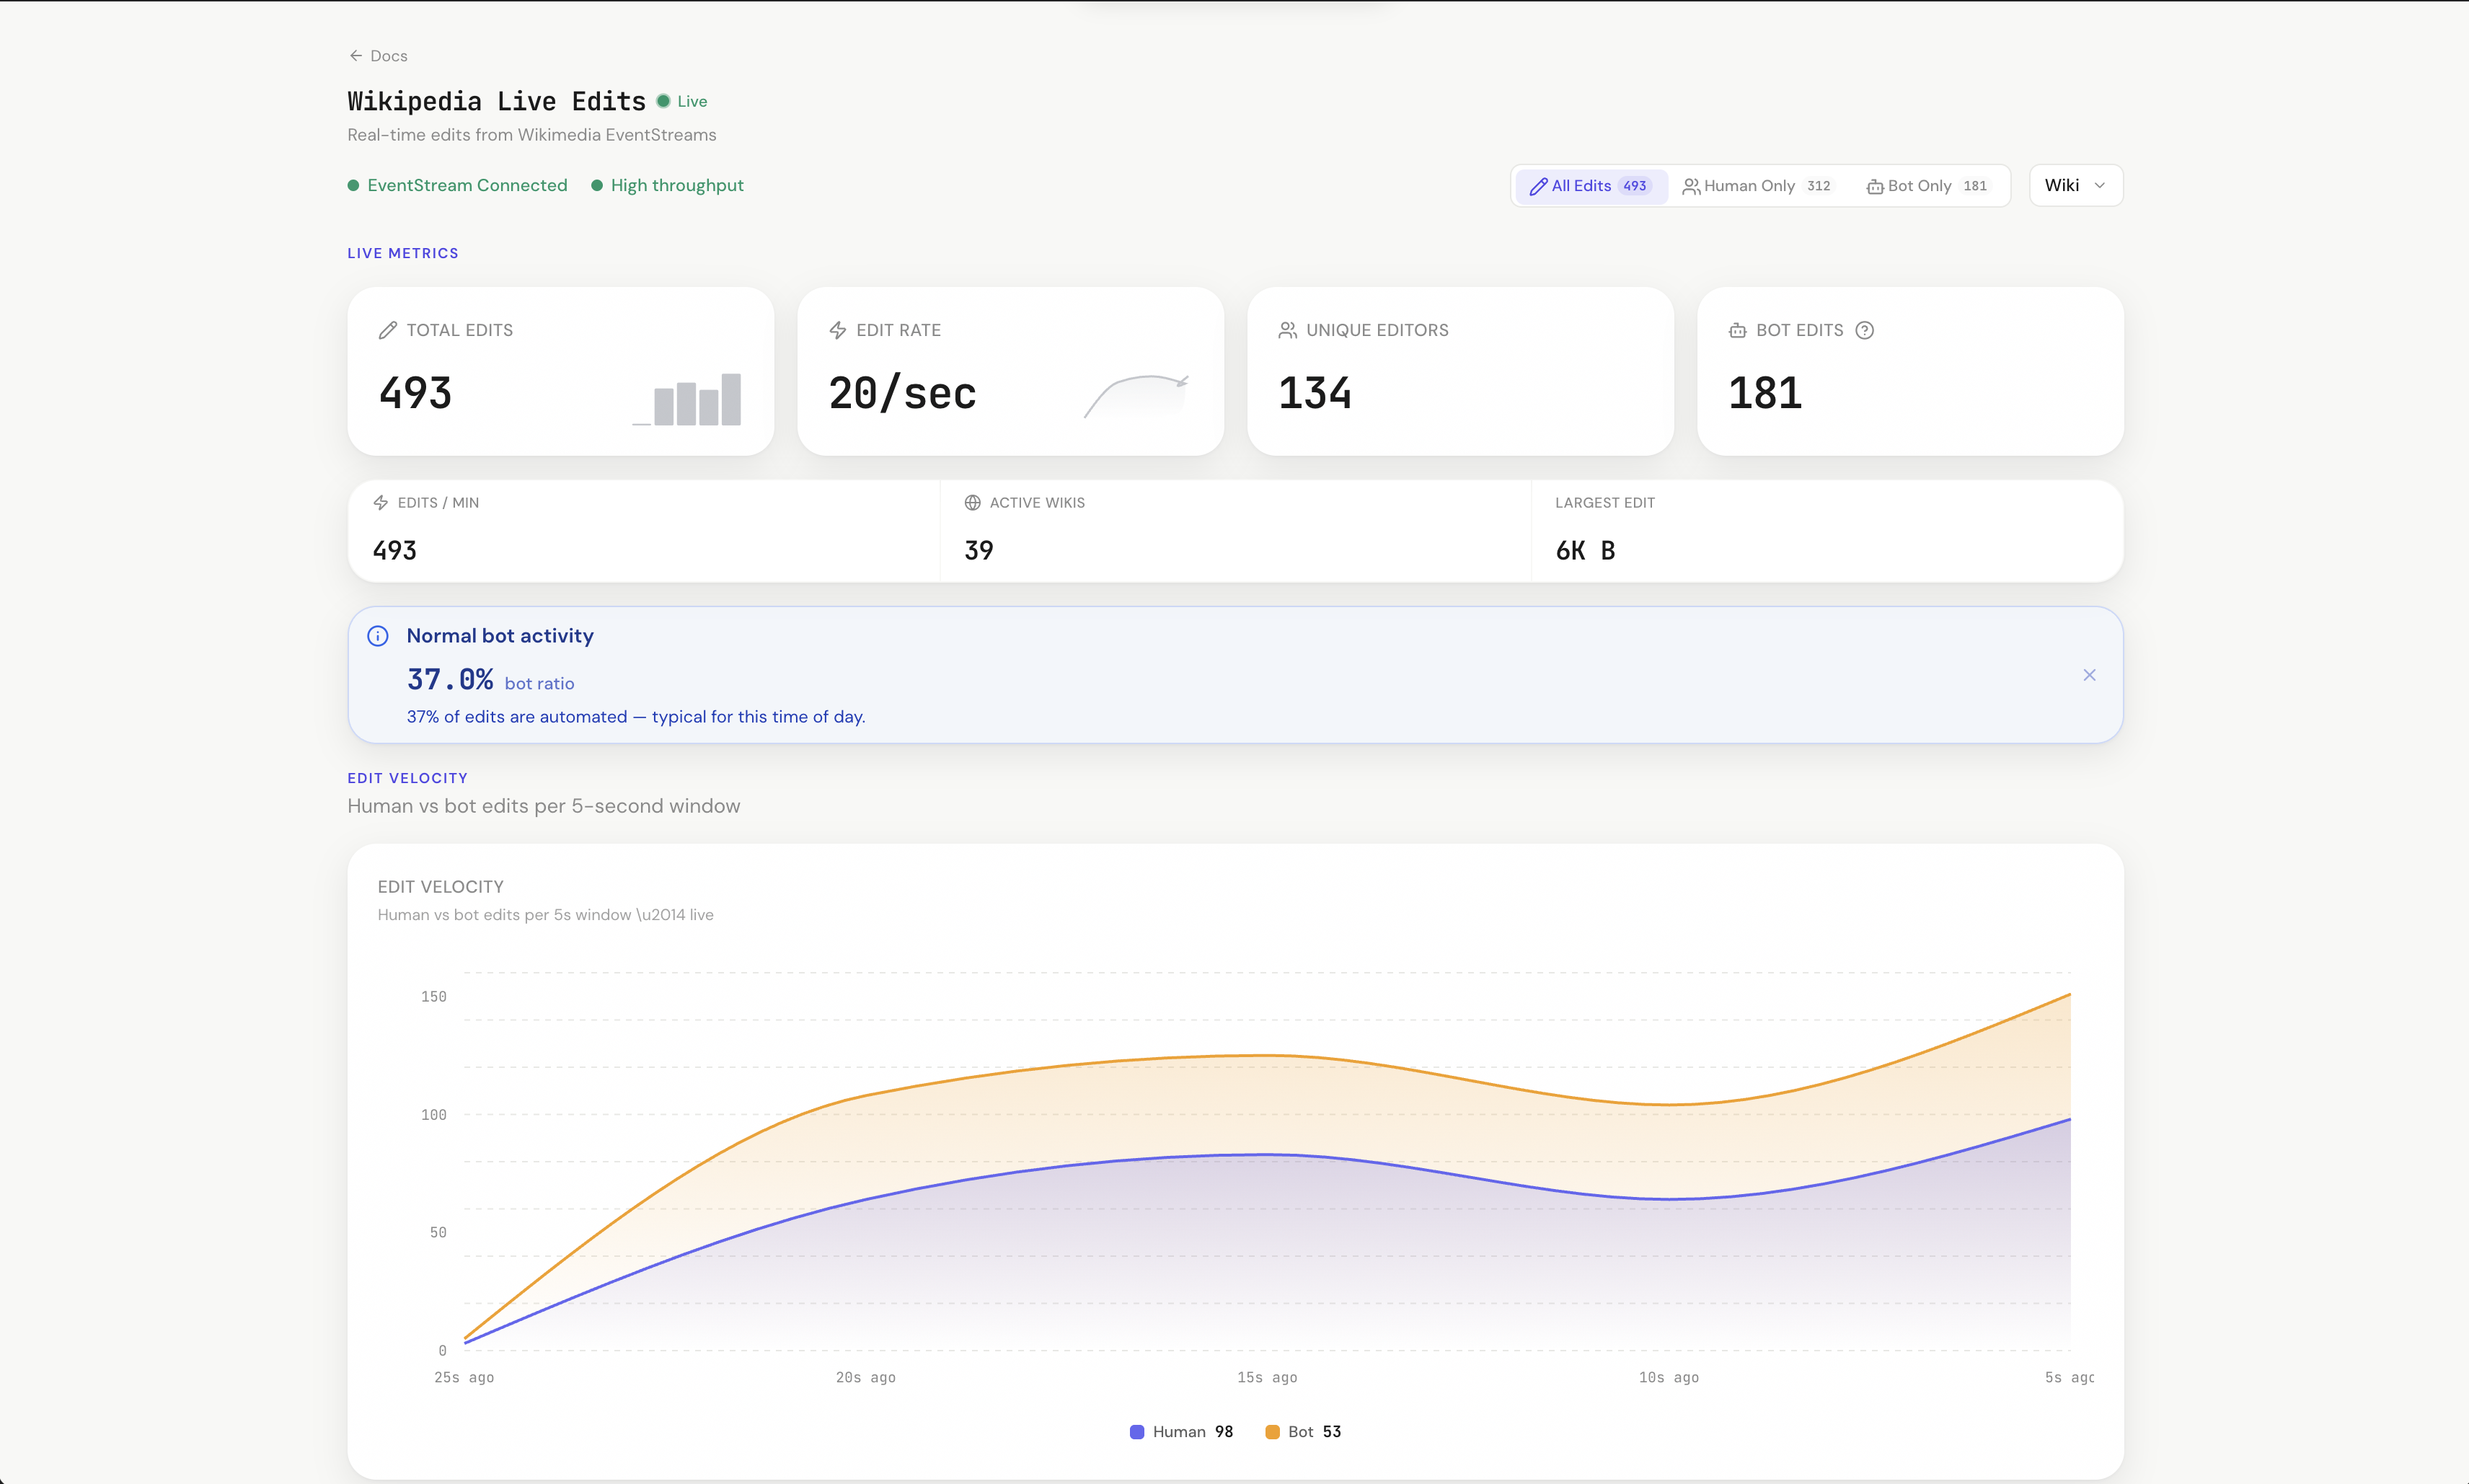
Wikipedia live demo in light mode.
CSS variables. Zero config. Every component adapts automatically. Theming guide →
Smart Format Engine
One prop formats any value. Currency, percentages, durations, compact notation — with locale support. Docs →
<KpiCard value={127450} format="currency" />        // → $127.5K
<KpiCard value={4.2} format="percent" />             // → 4.2%
<KpiCard value={3725} format="duration" />           // → 1h 2m 5s
<KpiCard value={2400000} format="number" />          // → 2.4M
Theme Presets
One prop. Entire dashboard changes color. 8 built-in presets. Custom presets via ThemePreset type. Theming guide →
<Dashboard theme="emerald">   // Green accent + green-first chart palette
<Dashboard theme="rose">      // Pink accent + pink-first chart palette
<Dashboard theme="amber">     // Warm amber everything
MetricGrid — Zero Layout Code
Drop components in. It figures out the layout. Docs →
<MetricGrid>
  <MetricGrid.Section title="Overview" />
  <KpiCard ... />  <KpiCard ... />  <KpiCard ... />
  <AreaChart ... />          {/* Auto 2/3 width */}
  <DonutChart ... />         {/* Auto 1/3 width */}
  <DataTable ... />          {/* Auto full width */}
</MetricGrid>
Filter System
Complete filter context — wire PeriodSelector, DropdownFilter, SegmentToggle, and FilterTags together with zero boilerplate. Filtering guide →
<Dashboard theme="indigo" filters={{ defaultPreset: "30d" }}>
  <DashboardHeader title="Dashboard" actions={<PeriodSelector comparison />} />
  <SegmentToggle options={["All", "Enterprise", "SMB"]} field="segment" />
  <DropdownFilter label="Region" options={regions} field="region" multiple />
  <FilterTags />  {/* Auto-renders active filters as dismissible chips */}
</Dashboard>
Saved Views & Shareable Links
useDashboardState() captures the entire dashboard state (filters, period, dimensions, cross-filter) as a JSON-safe snapshot. Serialize to URL params for shareable links or persist to localStorage / your backend. Cookbook recipe →
Data States
Every component handles loading, empty, error, and stale states out of the box. Docs →
Error Boundaries
One chart crashes? The rest keep running. Dev mode shows component name + actionable hints. Prod mode shows clean retry UI.
Accessibility
prefers-reduced-motion, focus-visible rings, ARIA attributes on charts, keyboard-accessible drill-downs. Docs →
Components
Cards & Metrics
| Component | What it does | Docs |
|---|---|---|
| KpiCard | Comparison badges, sparkline overlays, goal progress, conditional coloring, copyable, drill-down | Docs |
| StatGroup | Multiple metrics in a dense responsive grid row with per-stat comparisons | Docs |
Charts
| Component | What it does | Docs |
|---|---|---|
| AreaChart | Gradient fills, stacking, dual Y-axis, comparison overlays, reference lines, threshold bands | Docs |
| LineChart | Clean lines — same props as AreaChart without fill | Docs |
| BarChart | 6 presets, comparison/target bars, sorting, negative values, reference lines | Docs |
| BarLineChart | Dual-axis combo: bars + lines — unified data format | Docs |
| DonutChart | Center KPI content, arc labels, percentage mode | Docs |
| Gauge | Arc gauge with threshold zones, target markers, comparison badges | Docs |
| HeatMap | 2D matrix, cross-hair hover, sequential + diverging color scales | Docs |
| Funnel | Conversion pipeline with auto-computed rates | Docs |
| Waterfall | Sequential +/- changes with auto running totals, connectors | Docs |
| BulletChart | Actual vs target with qualitative range bands | Docs |
| ScatterPlot | Two-variable correlation with bubble size, reference lines, linked hover | Docs |
| Treemap | Hierarchical part-of-whole with flat or nested data | Docs |
| Calendar | GitHub-style heatmap with auto date range detection | Docs |
| Radar | Multi-axis comparison with overlay support | Docs |
| Sankey | Flow visualization with gradient links, flat or native data | Docs |
| Choropleth | Geographic heatmap with bundled world + US state maps, sqrt/log scale | Docs |
| Bump | Ranking chart with auto-ranking from flat data | Docs |
| Sparkline | Inline micro-chart with reference lines, bands, trend coloring | Docs |
| DataTable | Sort, search, pagination, expandable rows, 12 column types, pinned columns, row conditions | Docs |
Layout
| Component | What it does | Docs |
|---|---|---|
| Dashboard | All-in-one wrapper — replaces 5 nested providers in one component | Docs |
| DashboardHeader | Live/stale status, auto-ticking "Updated Xm ago", breadcrumbs, action slots | Docs |
| DashboardNav | Tab/scroll navigation with sliding indicator, keyboard nav, URL sync | Docs |
| MetricGrid | Smart auto-layout grid with staggered reveal animations | Docs |
| SectionHeader | Labeled divider with description popover, badge, action slot | Docs |
| Divider | Horizontal/vertical separator with label, icon, accent | Docs |
Filters
| Component | What it does | Docs |
|---|---|---|
| FilterProvider | Context that wires all filter components. useMetricFilters() hook | Guide |
| PeriodSelector | Date range presets, custom ranges, comparison toggle | Docs |
| DropdownFilter | Multi-select dimension filter with search, grouped options | Docs |
| SegmentToggle | Pill toggle with icons, badges, multi-select | Docs |
| FilterTags | Auto-renders active filters as dismissible chips | Docs |
Status & Alerts
| Component | What it does | Docs |
|---|---|---|
| Callout | Data-driven alerts with rules, {value} templates, embedded metrics | Docs |
| StatusIndicator | Rule-based health with 5 sizes, pulse animation, trend arrows | Docs |
| Badge | 6 variants, 3 sizes, custom colors, icons, dismiss | Docs |
AI-First: MCP Server + llms.txt
Most component libraries give you docs and hope the AI figures it out. MetricUI gives the AI structured knowledge of every component, every prop, and every pattern — so it generates production-quality dashboards on the first try.
# One command. That's it.
claude mcp add --transport stdio metricui -- npx -y @metricui/mcp-server
The difference is real
Here's what happens when you prompt an AI with "Build me a SaaS dashboard with MRR, churn, users, and revenue breakdown":
Without MetricUI MCP — what the AI generates with Recharts / generic components
// The AI guesses at library APIs, builds everything from scratch
import { LineChart, Line, XAxis, YAxis, PieChart, Pie } from "recharts";

export default function Dashboard() {
  return (
    <div className="p-8">
      <h1 className="text-2xl font-bold mb-6">SaaS Dashboard</h1>

      <div className="grid grid-cols-4 gap-4 mb-8">
        <div className="border rounded-lg p-4">
          <p className="text-sm text-gray-500">MRR</p>
          <p className="text-2xl font-bold">${(127450).toLocaleString()}</p>
          <p className="text-sm text-green-600">+12.3%</p>
        </div>
        <div className="border rounded-lg p-4">
          <p className="text-sm text-gray-500">Churn Rate</p>
          <p className="text-2xl font-bold">3.2%</p>
          <p className="text-sm text-green-600">-13.5%</p>
        </div>
        {/* ...more hand-built cards with no formatting engine, no sparklines,
            no conditional coloring, no goal tracking... */}
      </div>

      <LineChart width={800} height={300} data={data}>
        <XAxis dataKey="month" />
        <YAxis />
        <Line dataKey="revenue" stroke="#8884d8" />
        {/* No reference lines. No threshold bands. No comparison overlay.
            No dark mode. No loading states. No error boundaries. */}
      </LineChart>
    </div>
  );
}
Raw div cards. Manual number formatting. No sparklines, no conditions, no goals, no filters, no dark mode, no data states, no error boundaries. Every dashboard looks the same.
With MetricUI MCP — what the AI generates (real output, unedited)
import {
  Dashboard, DashboardHeader, PeriodSelector,
  MetricGrid, KpiCard, Callout, AreaChart, DonutChart, BarChart,
  DataTable, Badge,
} from "metricui";
import "metricui/styles.css";

export default function App() {
  return (
    <Dashboard theme="emerald" filters={{ defaultPreset: "30d" }}>
      <DashboardHeader
          title="SaaS Metrics"
          subtitle="Real-time metrics overview"
          lastUpdated={new Date()}
          actions={<PeriodSelector comparison />}
        />
        <MetricGrid>
          <MetricGrid.Section title="Key Metrics" />

          <KpiCard title="Monthly Revenue" value={127450} format="currency"
            comparison={{ value: 113500 }} comparisonLabel="vs last month"
            sparkline={{ data: [89, 94, 99, 103, 109, 114, 127],
              previousPeriod: [78, 82, 85, 88, 91, 95, 98], interactive: true }}
            conditions={[
              { when: "above", value: 115000, color: "emerald" },
              { when: "below", value: 90000, color: "red" },
            ]} />

          <KpiCard title="Churn Rate" value={3.2} format="percent"
            comparison={{ value: 3.7, invertTrend: true }}
            goal={{ value: 2.5, showTarget: true, showRemaining: true }}
            conditions={[
              { when: "below", value: 2.5, color: "emerald" },
              { when: "above", value: 4, color: "red" },
            ]} />

          <KpiCard title="Active Users" value={8420} format="number"
            comparison={{ value: 7680 }} copyable
            drillDown={true} />

          <KpiCard title="Conversion" value={4.8} format="percent"
            comparison={{ value: 4.2 }}
            sparkline={{ data: [3.1, 3.4, 3.8, 4.0, 4.1, 4.2, 4.8] }} />

          <Callout value={12.3} rules={[
            { min: 15, variant: "success", title: "Exceptional Growth",
              message: "Revenue grew {value}% — exceeding target by 50%." },
            { min: 5, max: 15, variant: "info", title: "Healthy Growth",
              message: "Revenue grew {value}% month-over-month." },
            { max: 0, variant: "error", title: "Revenue Declined",
              message: "Revenue dropped {value}%." },
          ]} action={{ label: "View growth report", onClick: () => {} }} />

          <MetricGrid.Section title="Trends" subtitle="Last 30 days" border />

          <AreaChart data={revenueData} comparisonData={comparisonData}
            format="currency" title="Revenue Trend"
            referenceLines={[{ axis: "y", value: 50000, label: "Target",
              color: "#10B981", style: "dashed" }]}
            thresholds={[{ from: 0, to: 40000, color: "#EF4444", opacity: 0.05 }]}
            xAxisLabel="Month" yAxisLabel="Revenue ($)"
            height={360} legend />

          <DonutChart data={breakdownData} format="currency"
            title="Revenue by Plan" centerValue="$99.4K" centerLabel="Total MRR" />

          <MetricGrid.Item span="full">
            <BarChart preset="grouped" data={channelData}
              keys={["revenue", "conversions"]} indexBy="channel"
              sort="desc" format="currency" title="Channel Performance" legend />
          </MetricGrid.Item>

          <MetricGrid.Section title="Details" border />
          <DataTable data={tableData} title="Top Customers" searchable
            columns={[
              { key: "name", header: "Customer", sortable: true },
              { key: "plan", header: "Plan",
                render: (v) => <Badge variant={v === "Enterprise" ? "info" : "default"}>{String(v)}</Badge> },
              { key: "mrr", header: "MRR", format: "currency", sortable: true },
              { key: "status", header: "Status",
                render: (v) => <Badge variant={v === "active" ? "success" : v === "at-risk" ? "warning" : "danger"}>{String(v)}</Badge> },
            ]} />
        </MetricGrid>
    </Dashboard>
  );
}
Same prompt. The AI with MetricUI MCP generates:
- DashboardHeader with live status + auto-ticking "Updated Xm ago"
- Dashboard wrapper with filters, cross-filtering, and comparison toggle
- MetricGrid auto-layout (zero CSS)
- KpiCards with conditional coloring, goal progress bars, sparkline overlays, drill-down links
- AreaChart with dashed target reference line, danger zone threshold band, and previous-period comparison overlay
- Data-driven Callout that auto-picks severity from a growth number
- Sorted grouped BarChart, DonutChart with center KPI
- Searchable DataTable with Badge status columns
- Theme preset, dark mode, animations, error boundaries — all automatic
The AI doesn't guess. It knows. 13 tools, 26 components, every prop, every pattern. Full MCP Server docs →
llms.txt
Machine-readable documentation for AI models at /llms.txt. Every component, every prop, every type, every pattern — so even AI tools without MCP support can generate correct MetricUI code.
Roadmap
MetricUI is building toward 1.0 — cross-filtering, zero-config charts, anomaly detection, data stories, and a stable API you can build on with confidence. See what's shipped, what's next, and where we're headed:
Built With
- Nivo — chart rendering (line, bar, pie, heatmap)
- Tailwind CSS — styling (ships pre-built, Tailwind not required in your project)
- Lucide — icons
- React 18/19
License
MIT
Built for developers who care about design.
Featured
Keeps your Mac awake while Claude Code, Codex or Cursor works. Lets it sleep when they are done.
Try free for 7 days →Block distracting apps from your iPhone permanently without a 3rd party app. Free and open source.
Block now (100% free) →Notes, actions and memory. Without a meeting bot. First month 100% off.
Download for free →belt cli automatically finds the best tools and skills for your agent. image, video, music, tts...
one prompt install →Free an open-source skills that make AI coding agents easier to understand, verify, and control.
Download for free →Connect your Claude agent to live crypto prices and trading routes via 1inch
Get the MCP →Categories
Registryactive
Package@metricui/mcp-server
TransportSTDIO
UpdatedMar 22, 2026


